Histograms in Capture One
Histograms in Capture One can be both a source of information or confusion. A histogram is an important tool during image adjustments. Learn what a histogram tells you, the different histograms in Capture One and their relationship.
Histograms in Capture One
Understanding the Histogram tool can help you to achieve better results. On the other hand, users are often confused between the different tools in Capture One that have a histogram. This is because the histogram graph often does not match. These topics and more are covered in this post.
More
This post has a follow up in Processing Pipeline in Capture One. This post looks at a deeper level at the order in which Capture One processes your adjustments.
Understanding The Histogram Tool
First, let us take a closer look at the Histogram tool in Capture One. You find this tool at the top of both the Color and the Exposure tool tab if you use the default workspace. It is the same tool with the same graph.
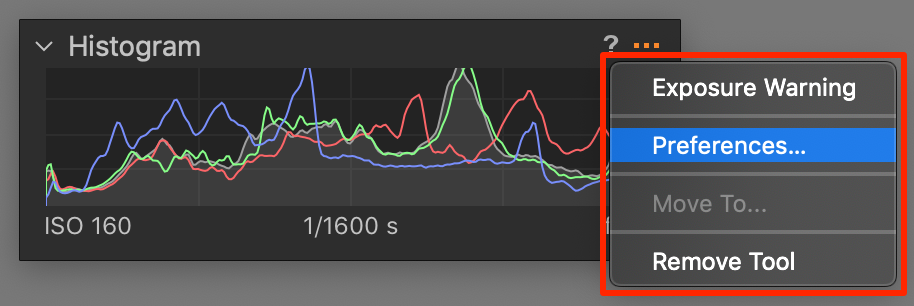
The tool shows a graph, the actual histogram, basic exposure information at the bottom, and at the top a question mark for direct access to the online help and the 3-dots to the action menu.
The Graph
The graph in the Histogram tool in Capture One represents the distribution of pixels over the entire range from dark to bright. Many pixels for a certain level results in a mountain peak, few pixels in a valley.
Note that for a color image there is not one graph but four, one for red, green, and blue and one for luminance.
When you hover your mouse cursor over the image in the Viewer, you see a vertical orange line moving horizontally over the graph. The position of the line corresponds with the levels of the image where the mouse cursor is.
More Information
At the bottom of the tool, below the graph, you see the ISO, shutter speed and aperture of the selected image, the Primary Variant.
In the top right corner, you find the 3-dot symbol to access the action menu. Here you can enable or disable the Exposure Warning and open the Preferences > Exposure tab. Here you can configure the exposure warning thresholds.
For more about Preferences, please go to Capture One Preferences.
A Good Histogram
Although you can read a lot of information about your image from the Histogram tool in Capture One, I would like to warn you not to think too much in terms of good or bad. It heavily depends on the kind of subject in your image.
For a start, it is good to understand that a mountain peak at either end of the graph typically means that a considerable amount of pixels do not contribute to the visible part of the image. We say that they are clipped into total white (right side) or black (left).
In the image above with its histogram on top, the black curtains create a mountain peak at the left in the graph.
That could be a bad sign for a landscape image, but good news for a model in a studio with a white background that should not show any detail (the background that is, not the model).
A graph with a peak in the middle and no pixels at the left and right end means that you have a lot of mid-tones but few or no dark and bright tones in your image. This is known as an image with low contrast.
That could be a bad sign for a landscape image unless it was taken during heavy fog, and you want to maintain the mood of that moment.
Making Adjustments
When you start making adjustments, you notice that the graph in the Histogram tool changes. Increasing the Exposure will move the entire graph to the right and increasing Contrast will push pixels from the middle towards the end, potentially leading to clipping.
Color adjustments from the White Balance tool, the Color Balance tool or the Color Editor also have their effect on the Histogram.
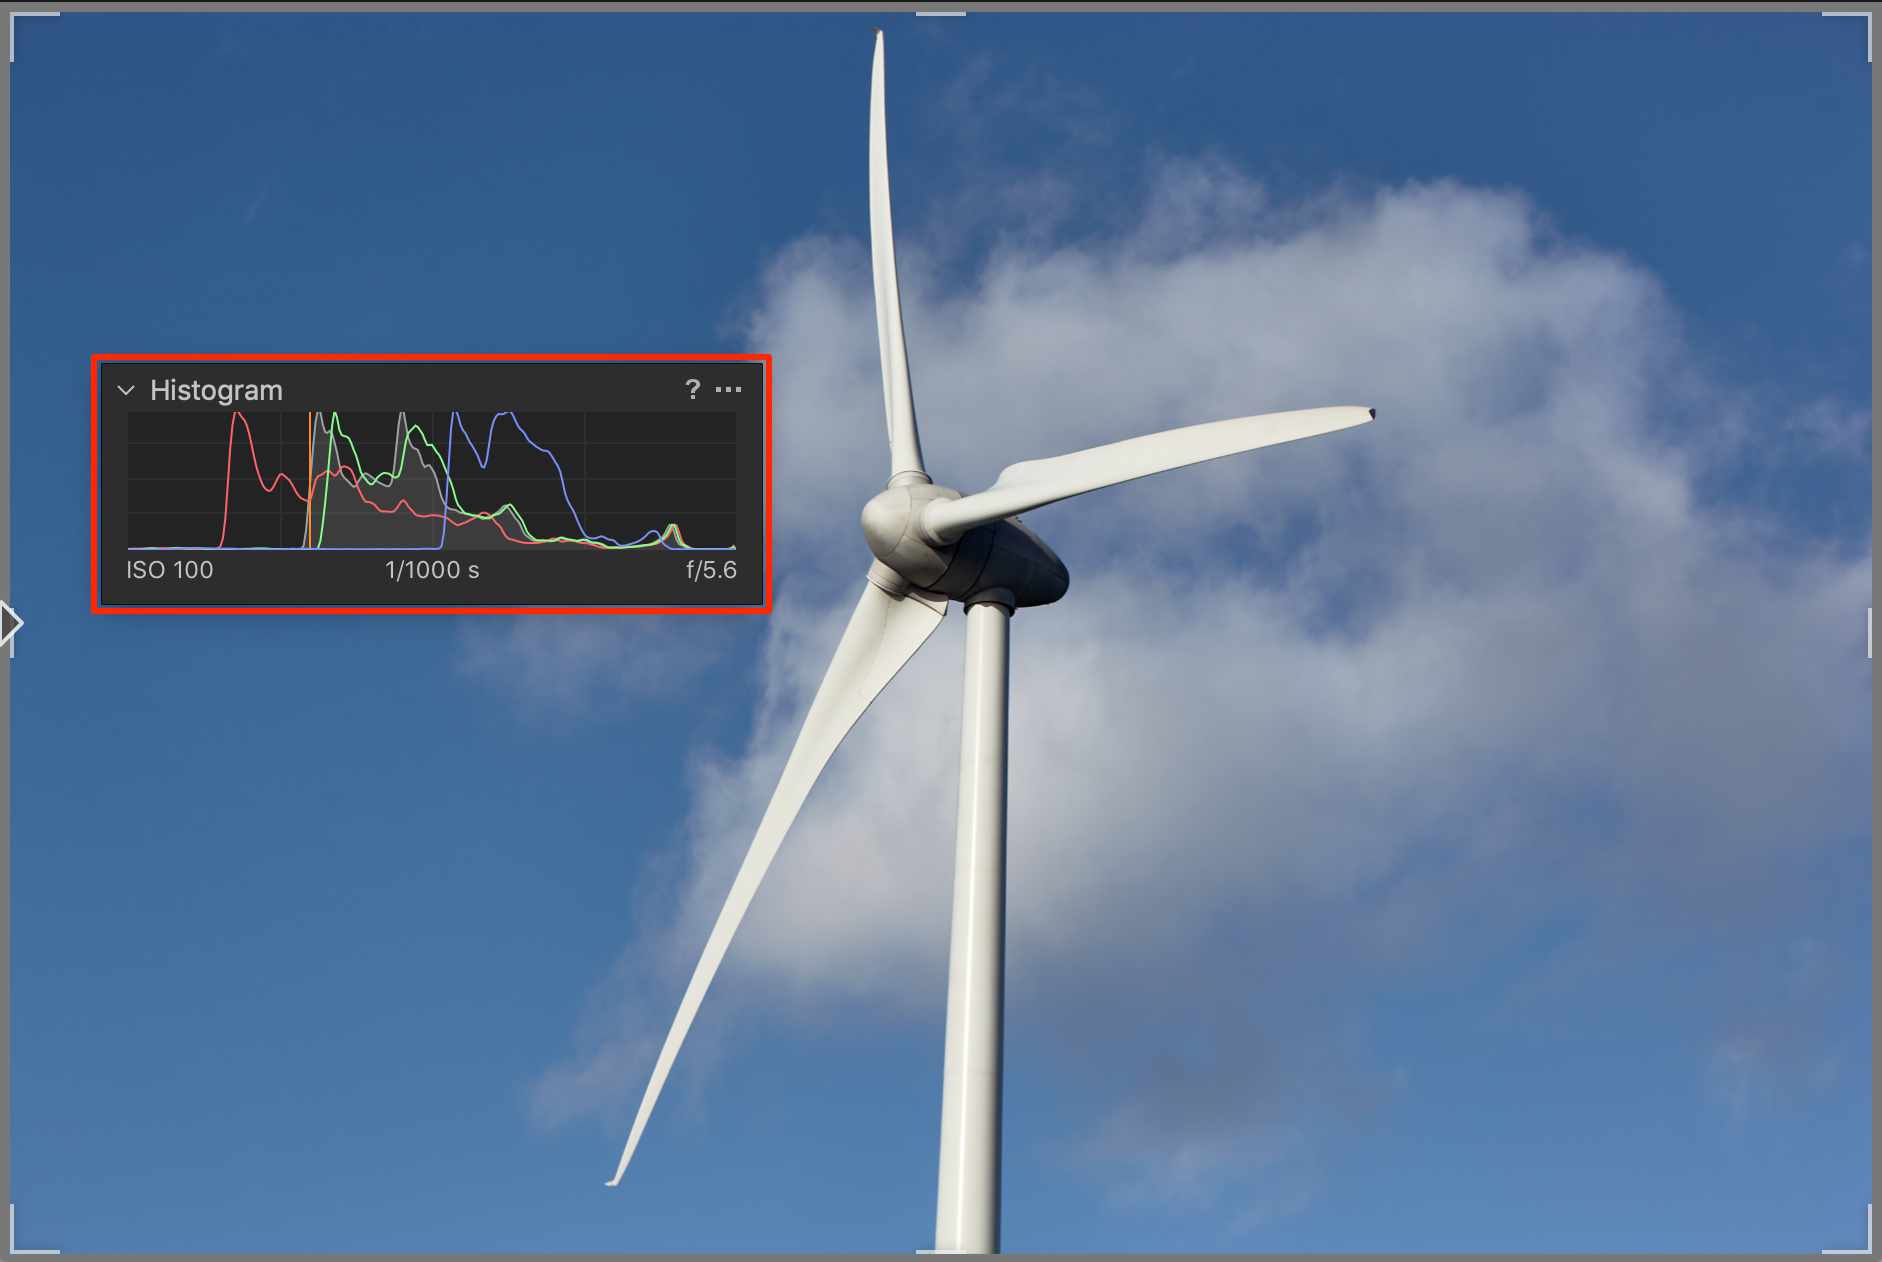
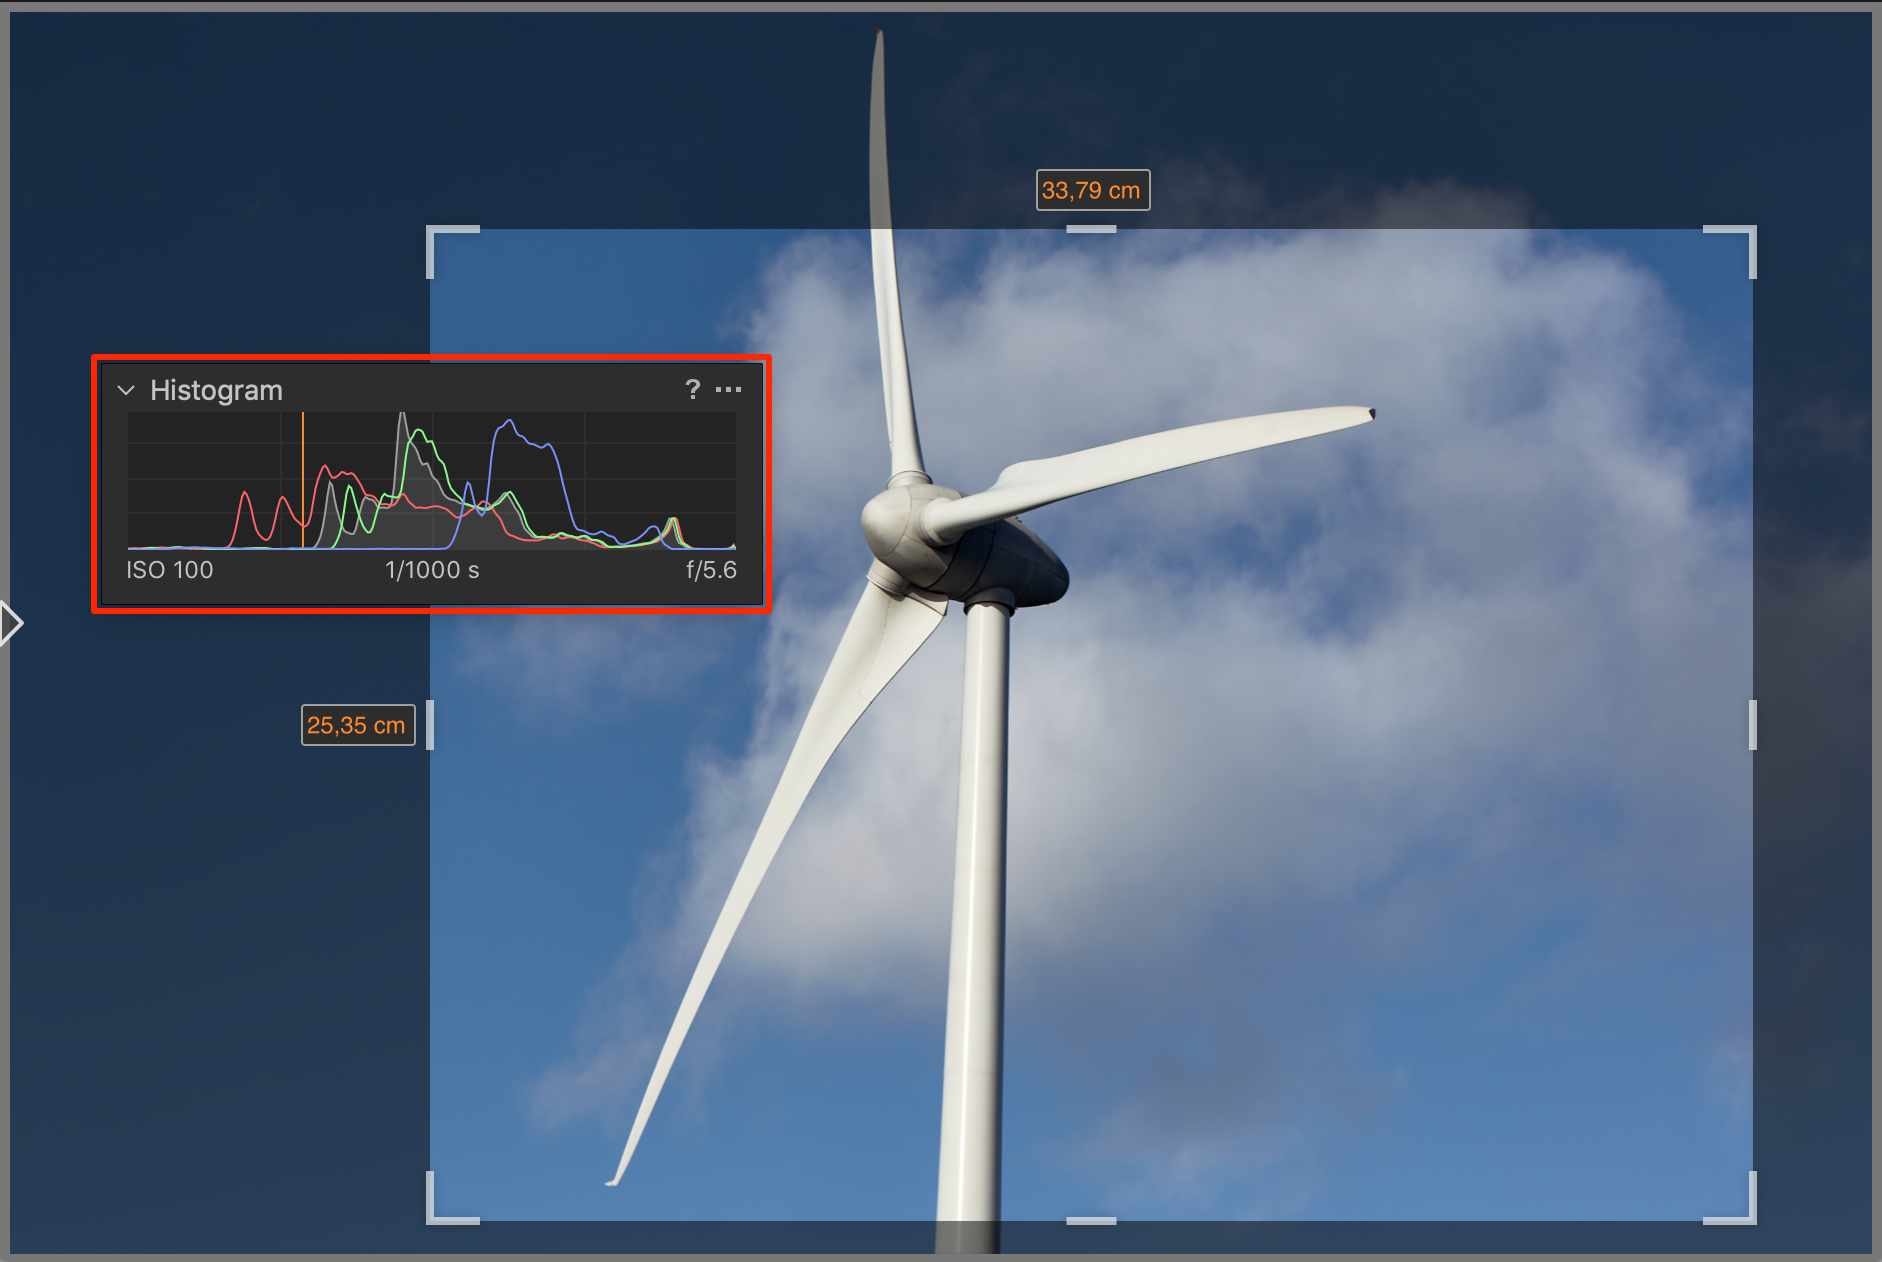
Changes to the composition, like cropping, arbitrary rotation and keystone affect the Histogram as well. That makes sense because the Histogram shows the distribution of pixels in the crop, not the entire image.
For this reason, the composition is often done at the beginning of the editing process.
Final Result
The graph in the Histogram tool represents the final result of all your adjustments, including the output profile of the selected Process Recipe. Adjust a slider, make a crop, set shadow or highlight point in the Levels tools or create a curve in the Curve tool, and the graph in the Histogram tool will adapt to reflect the new status.
In other words, the Histogram lets you have a look at your image at the end of the processing pipeline. This pipeline defines the order in which Capture One processes your adjustments.
Levels Tool
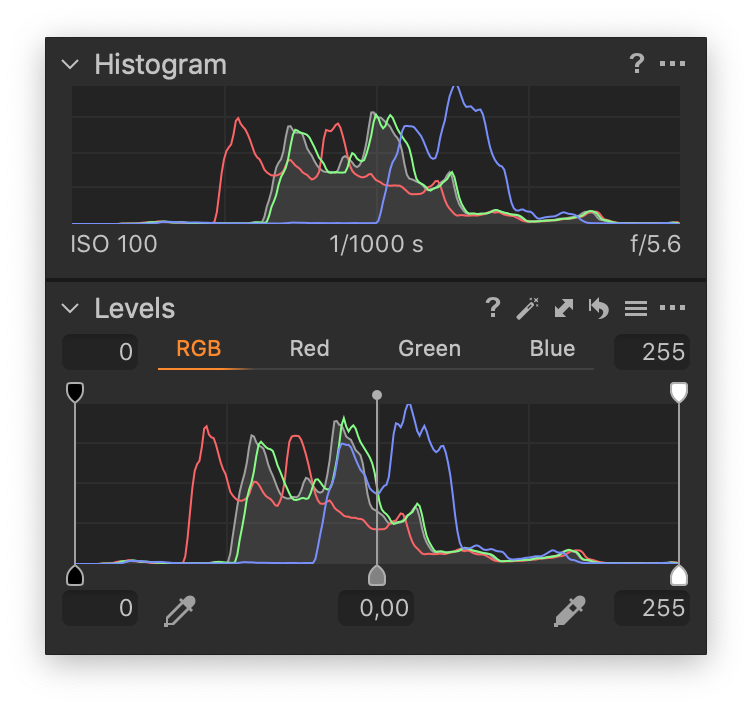
Let us jump to the Levels tool. Because this tool and the Histogram look very similar, users compare them and often notice a different graph between these tools.
The Levels tool and the Histogram tool show a histogram at different positions in the processing pipeline. Tools that are behind the Levels tool in that pipeline, affect the Histogram tool, but not the Levels tool. However, even without any image adjustment, the graphs can be different.
Please note that in the past I wrote several posts about the Levels tool. In case you like to dive deeper into its working please references Capture One Levels.
Other Tools With Histograms
There are two more tools with a histogram in Capture One, the Curve tool, and the Exposure Evaluation tool. Let’s have a look at both these tools.
Curve Tool
When you look at both the Levels and the Curve tool and play with adjustments, you will notice that the Levels adjustments affect the Curve’s histogram. The output from the Levels tool is fed into the Curve tool.
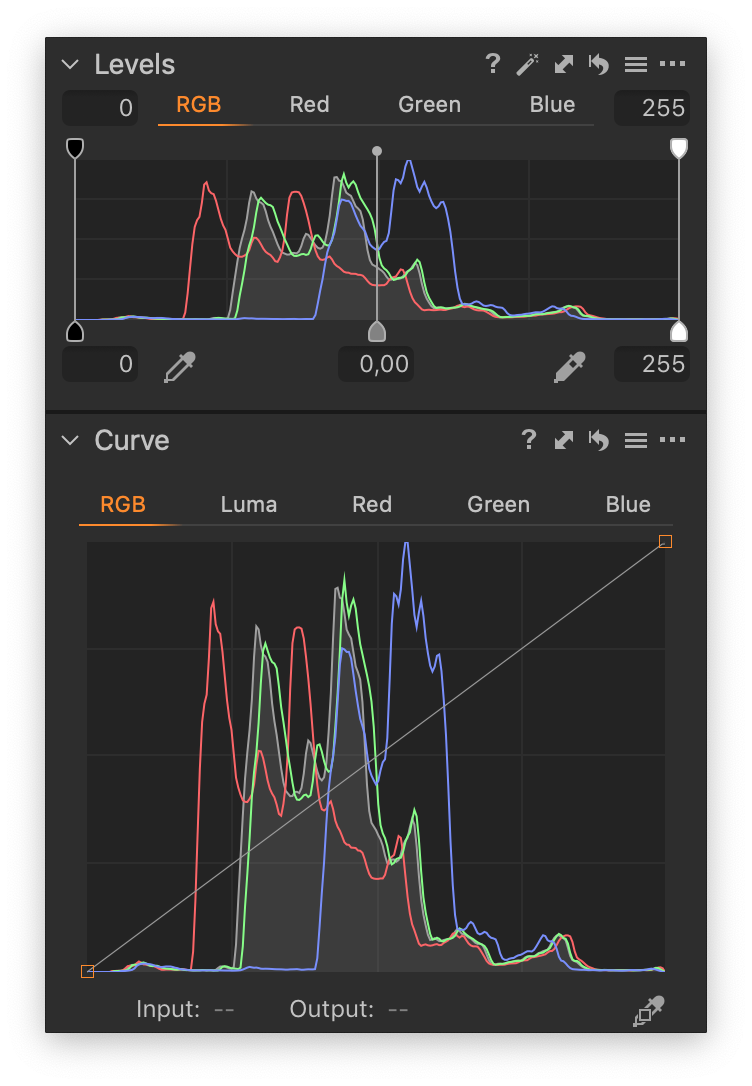
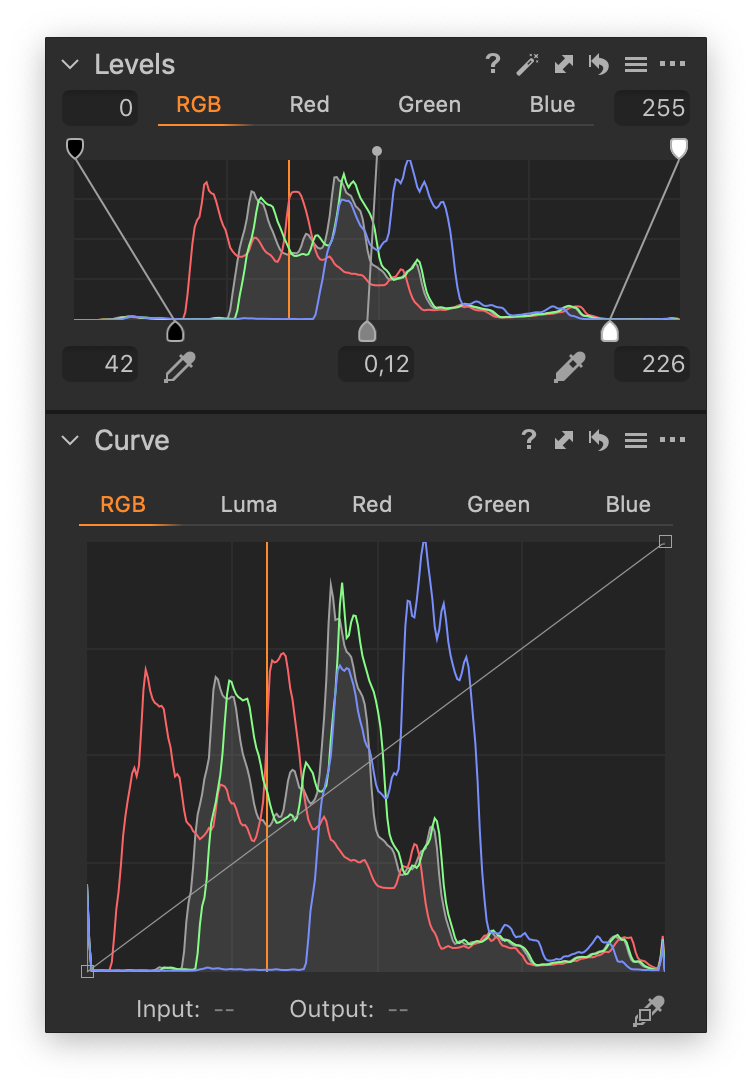
Without adjustments in the Levels tool, you see that the graphs in both Levels and Curve tools are very similar. In the Curve tool, the Y-axis is stretched to make more precise adjustments.
Now the order of these tools on the Exposure tool tab starts making even more sense. And in case you like to read more about the Curve tool, please reference Capture One Curve.
Exposure Evaluation Tool
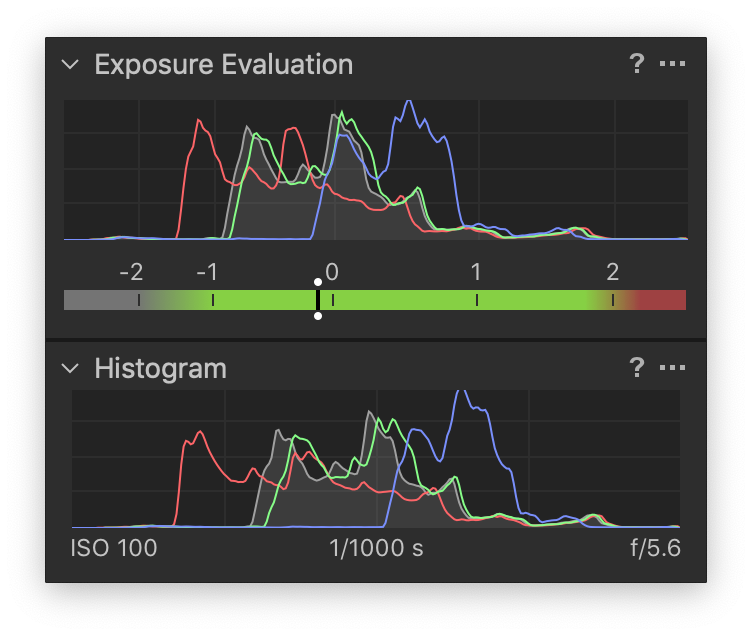
To wrap up this explanation about histograms in Capture One we finish with the Exposure Evaluation tool. If you are not a tethered shooter you might not be familiar with this tool.
As the name suggests its purpose is to give you an indication about the exposure during a shoot. But also after the fact, or when shooting to a card and importing your images into Capture One, you can use this tool.
Experimenting with adjustments in Capture One will learn you that only very few tools have an effect on the shape of this histogram. Typically, the film curve in the Base Characteristics and the White Balance tool does have an effect.
As you guessed by now, the graph of the Exposure Evaluation tool shows us the status of the image very much at the beginning of the processing pipeline in Capture One.
All You Need To Know About Histograms
Let me summarize all these histograms in Capture One for you. When you look at them in the same order as that Capture One provides information, we read:
- Exposure Evaluation
- Levels (RGB tab)
- Curve (RGB tab)
- Histogram
I hope you get a better insight in the histograms in Capture One and know how to use them to your benefit. If you like to dig more into this matter, please refer to Processing Pipeline in Capture One.
Thank you
For reading. Please feel free to leave a comment. Like us on Facebook or subscribe to stay informed about new blogs.
Want to try Capture One? Or would you like to buy it?
Best Regards,
Image Alchemist







Leave a Reply
Want to join the discussion?Feel free to contribute!